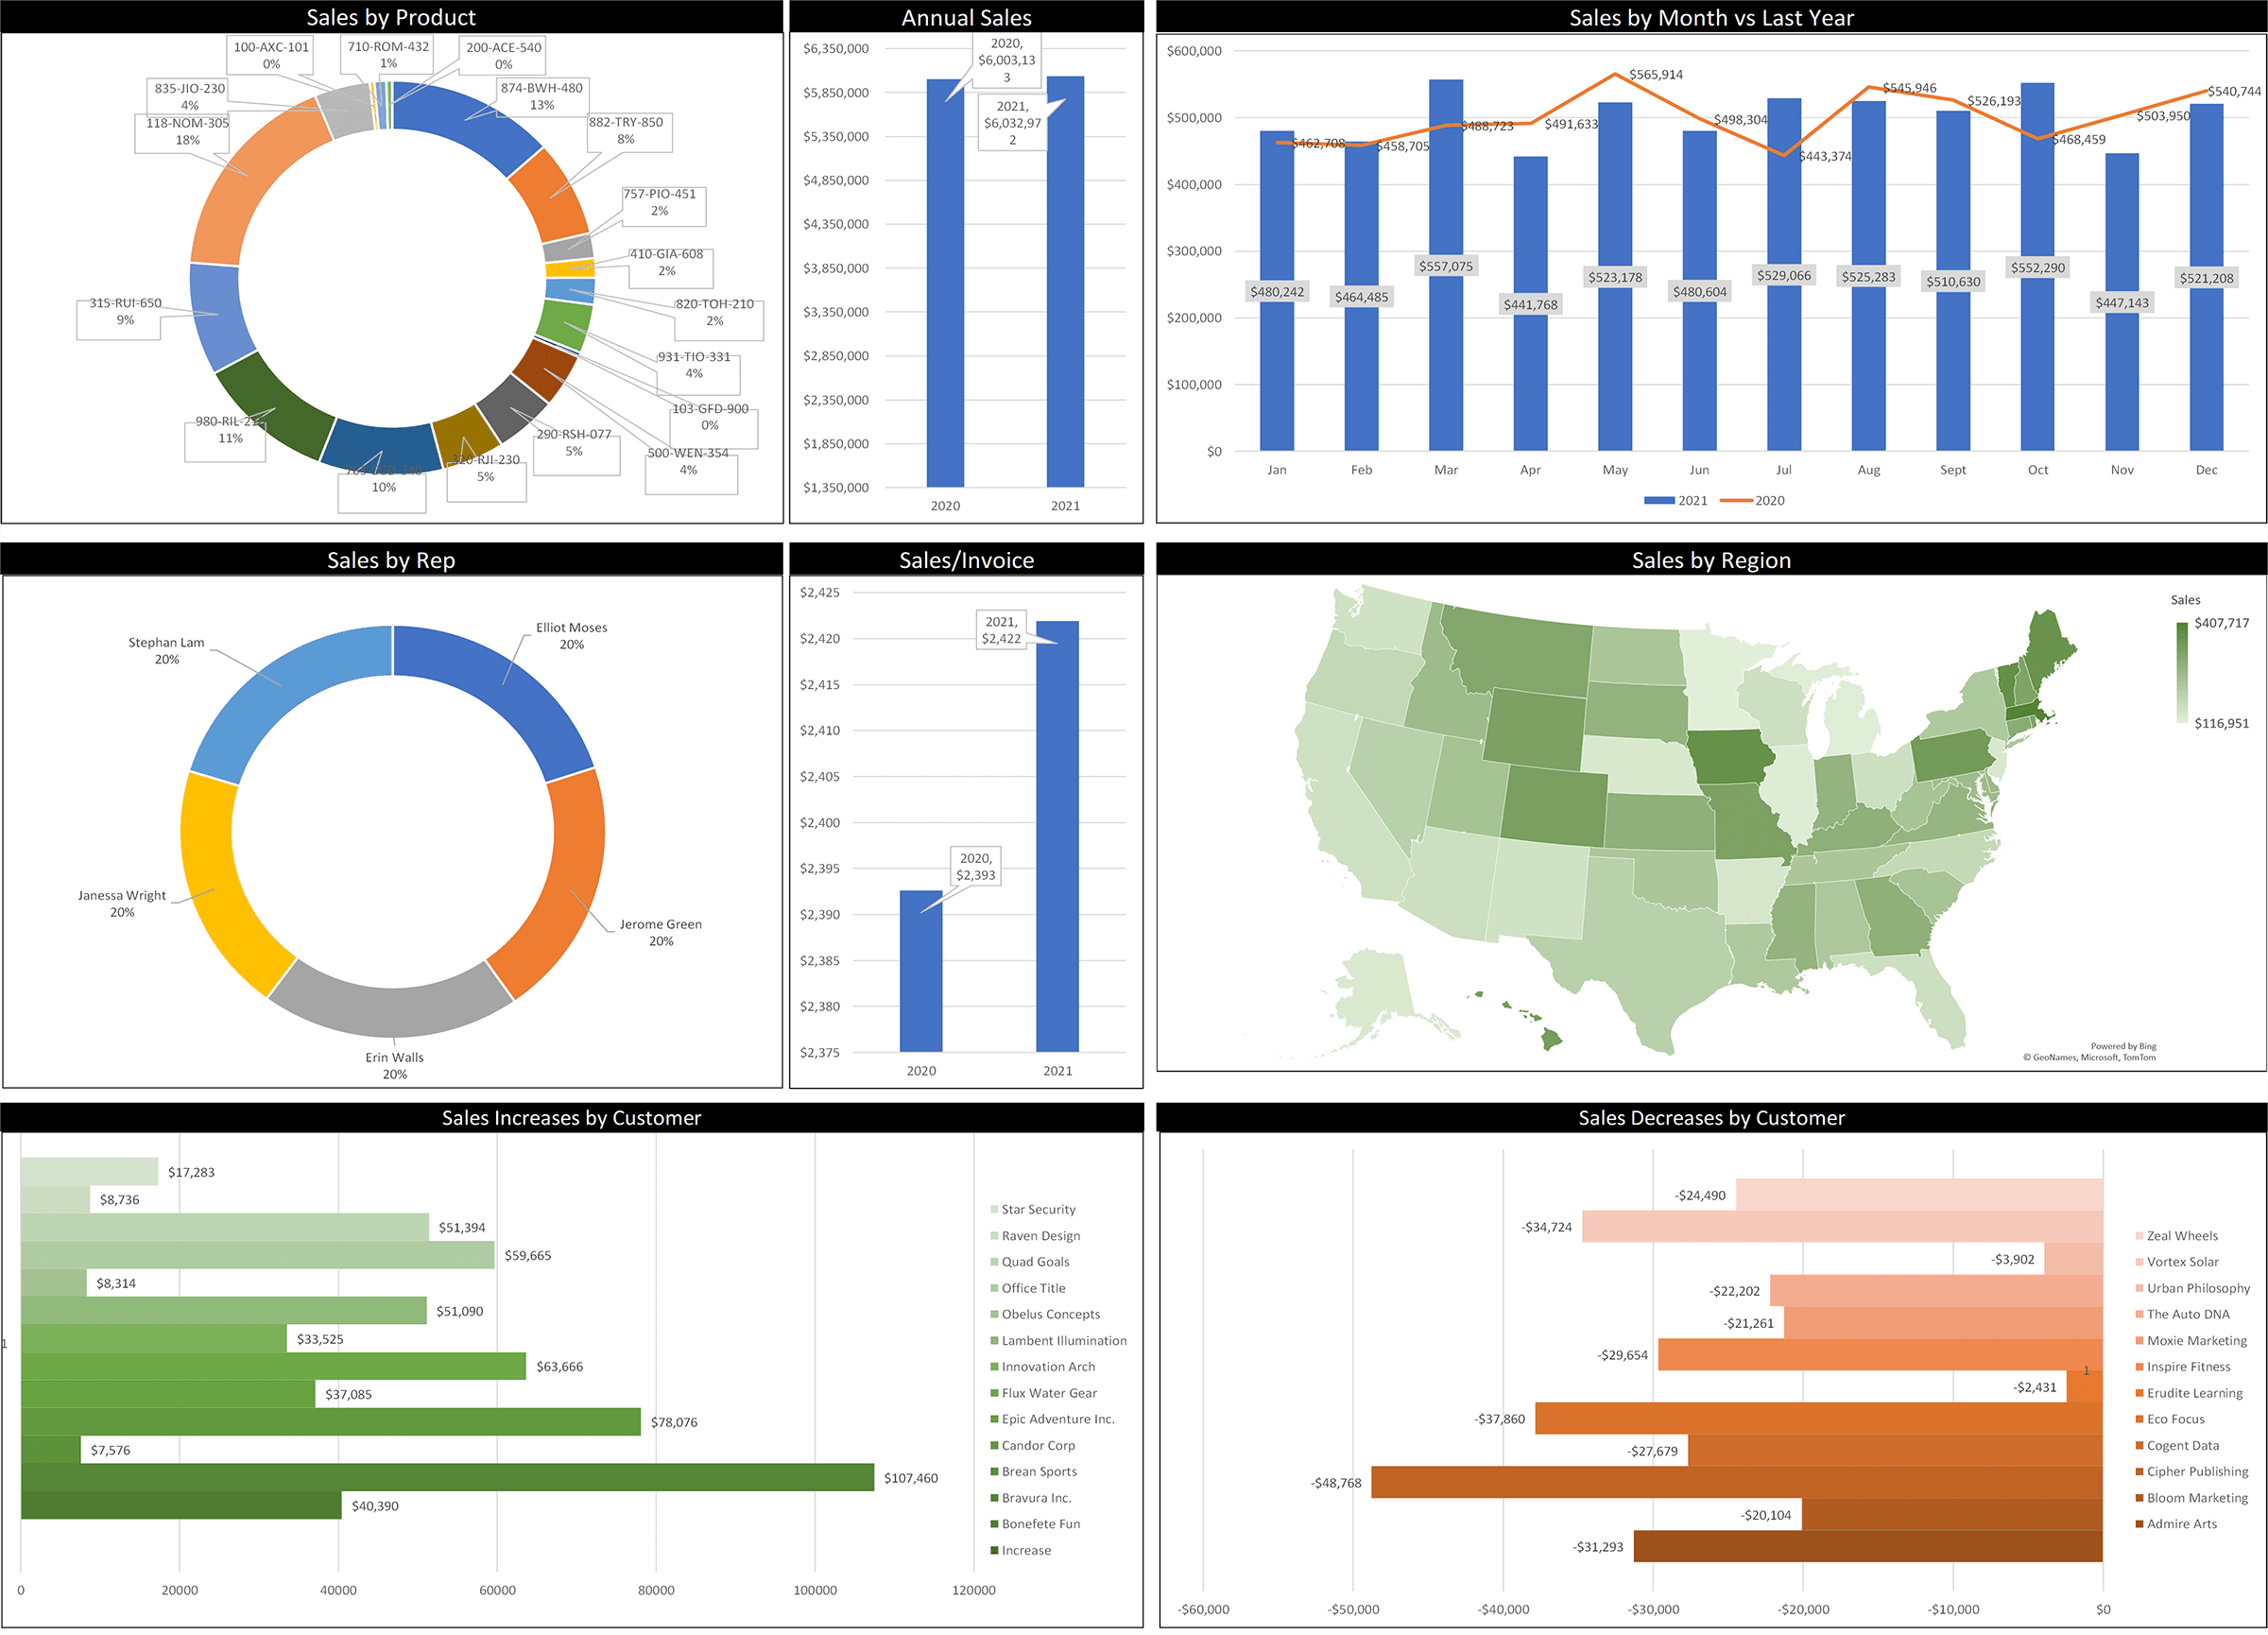
Sales Analysis Excel Dashboard
One of the most common dashboards we develop for our clients is for Sales Analysis. Most business organizations have a lot of sales data available in the form of customer invoices or customer sales orders. This data can be presented very effectively on a Excel Dashboard. This dashboard typically offers real-time insights into sales trends, sales increases and decreases, sales by product, sales by sales rep, sales by customer, and sales by region. These insights can help you identify issues such as lost customers or competitive challenges.
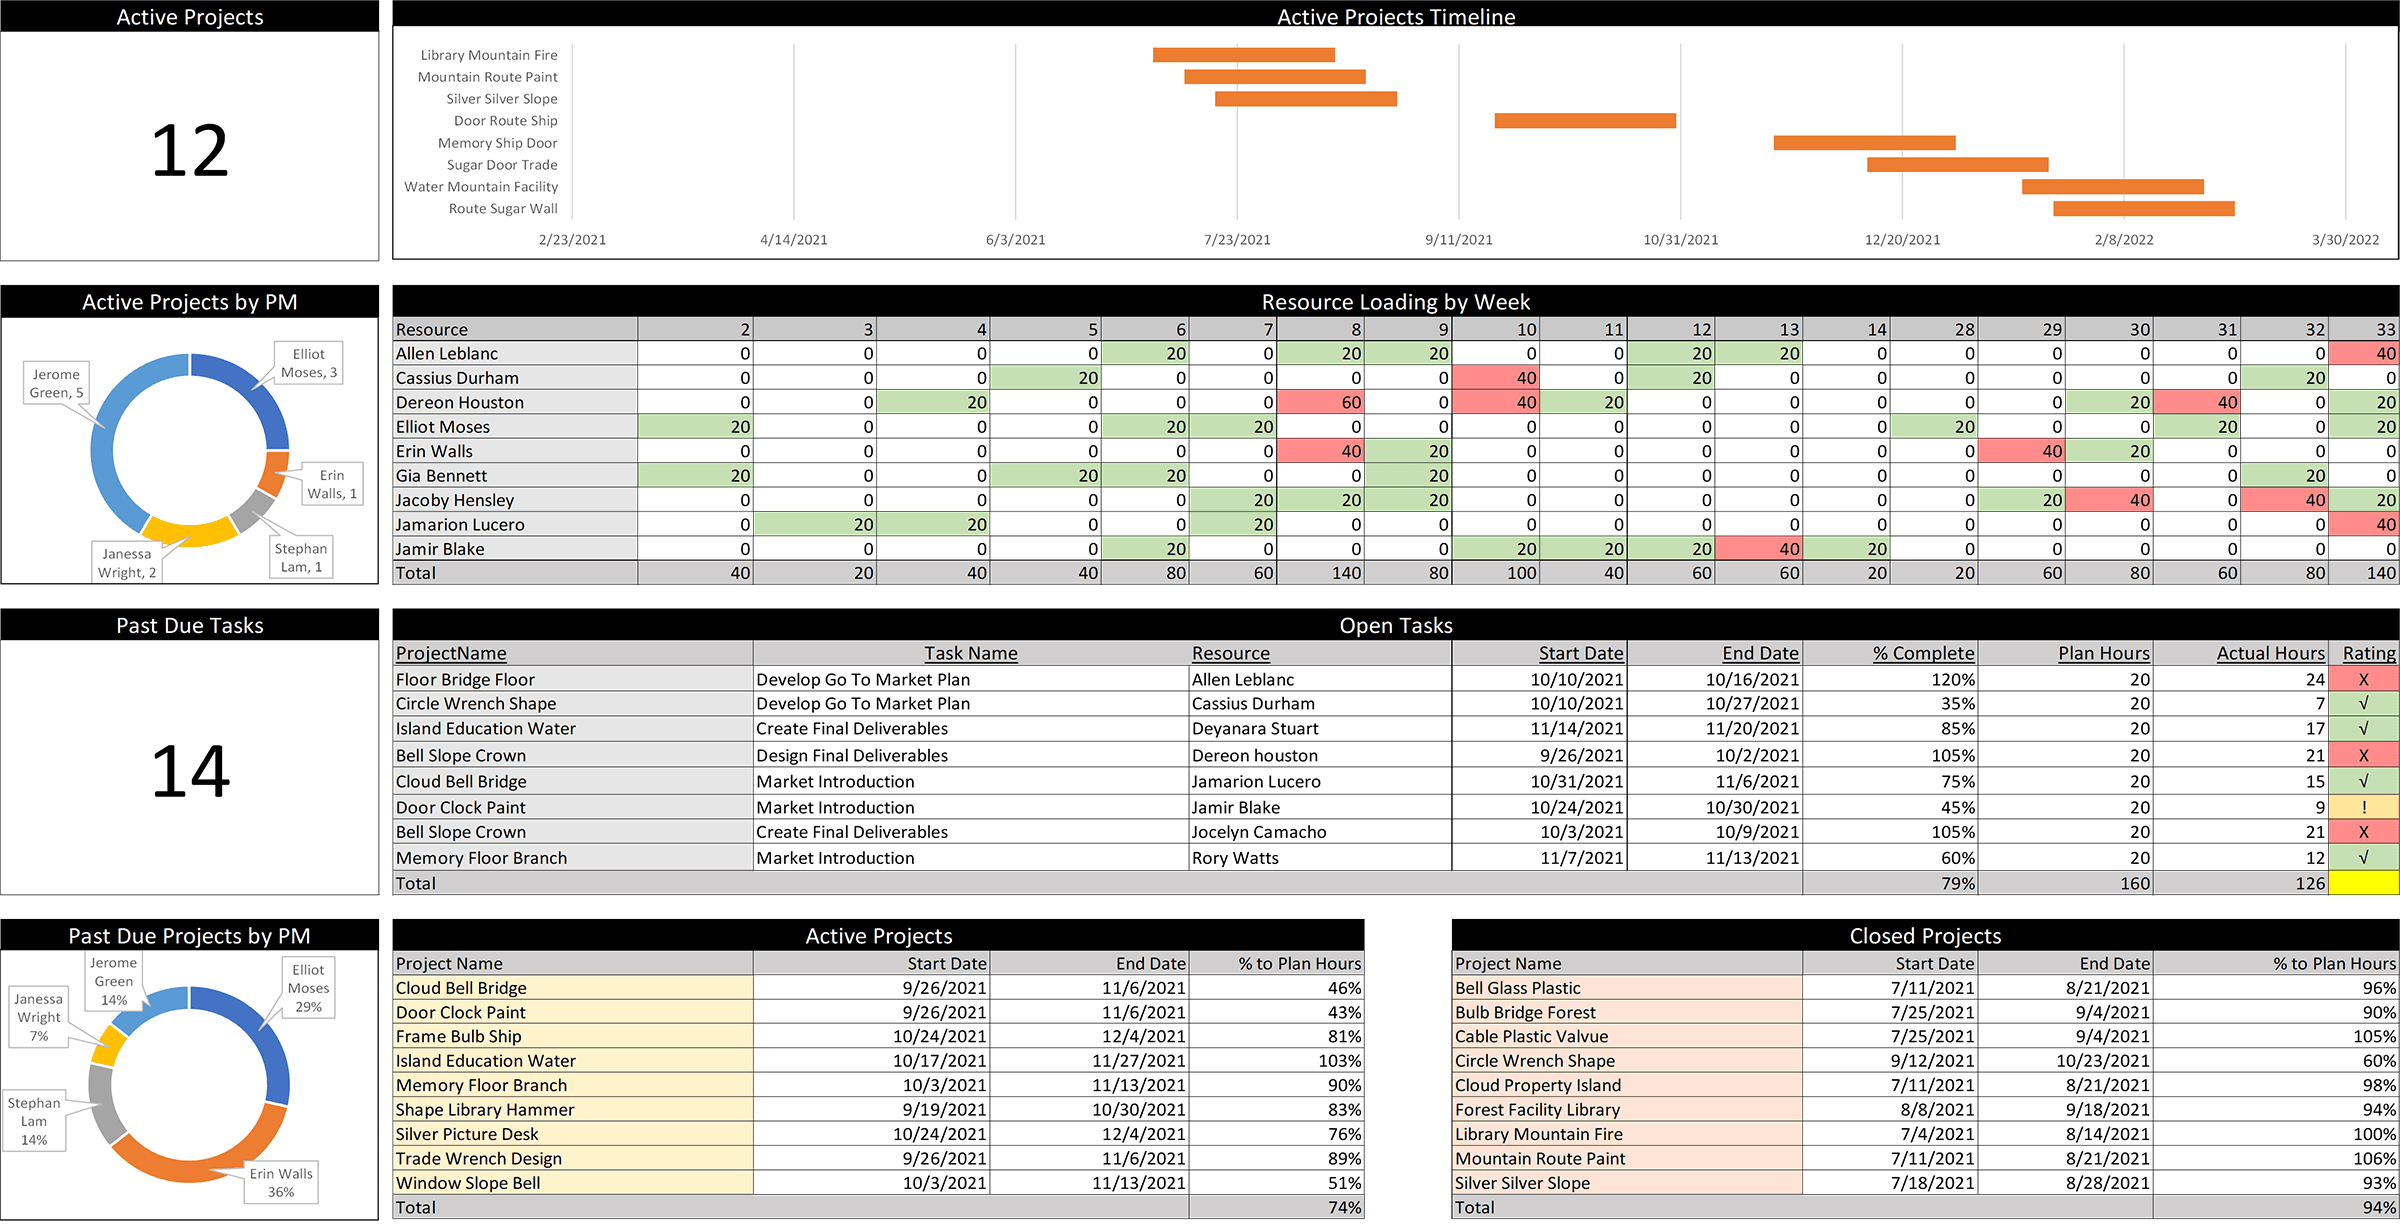
Project Management Excel Dashboard
Project Managers deal with complex data including projects, project dates, tasks, task dependencies, task dates, task effort, resources, resource loading, and more. A well-designed Excel Dashboard can help bring clarity to a Project Manager’s job by organizing this data effectively. Excel includes helpful project-oriented visualizations such as a Gantt chart timeline and a resource loading matrix. The manager will have instant insights into past due tasks, resource overload situations, at-risk timelines, and more.
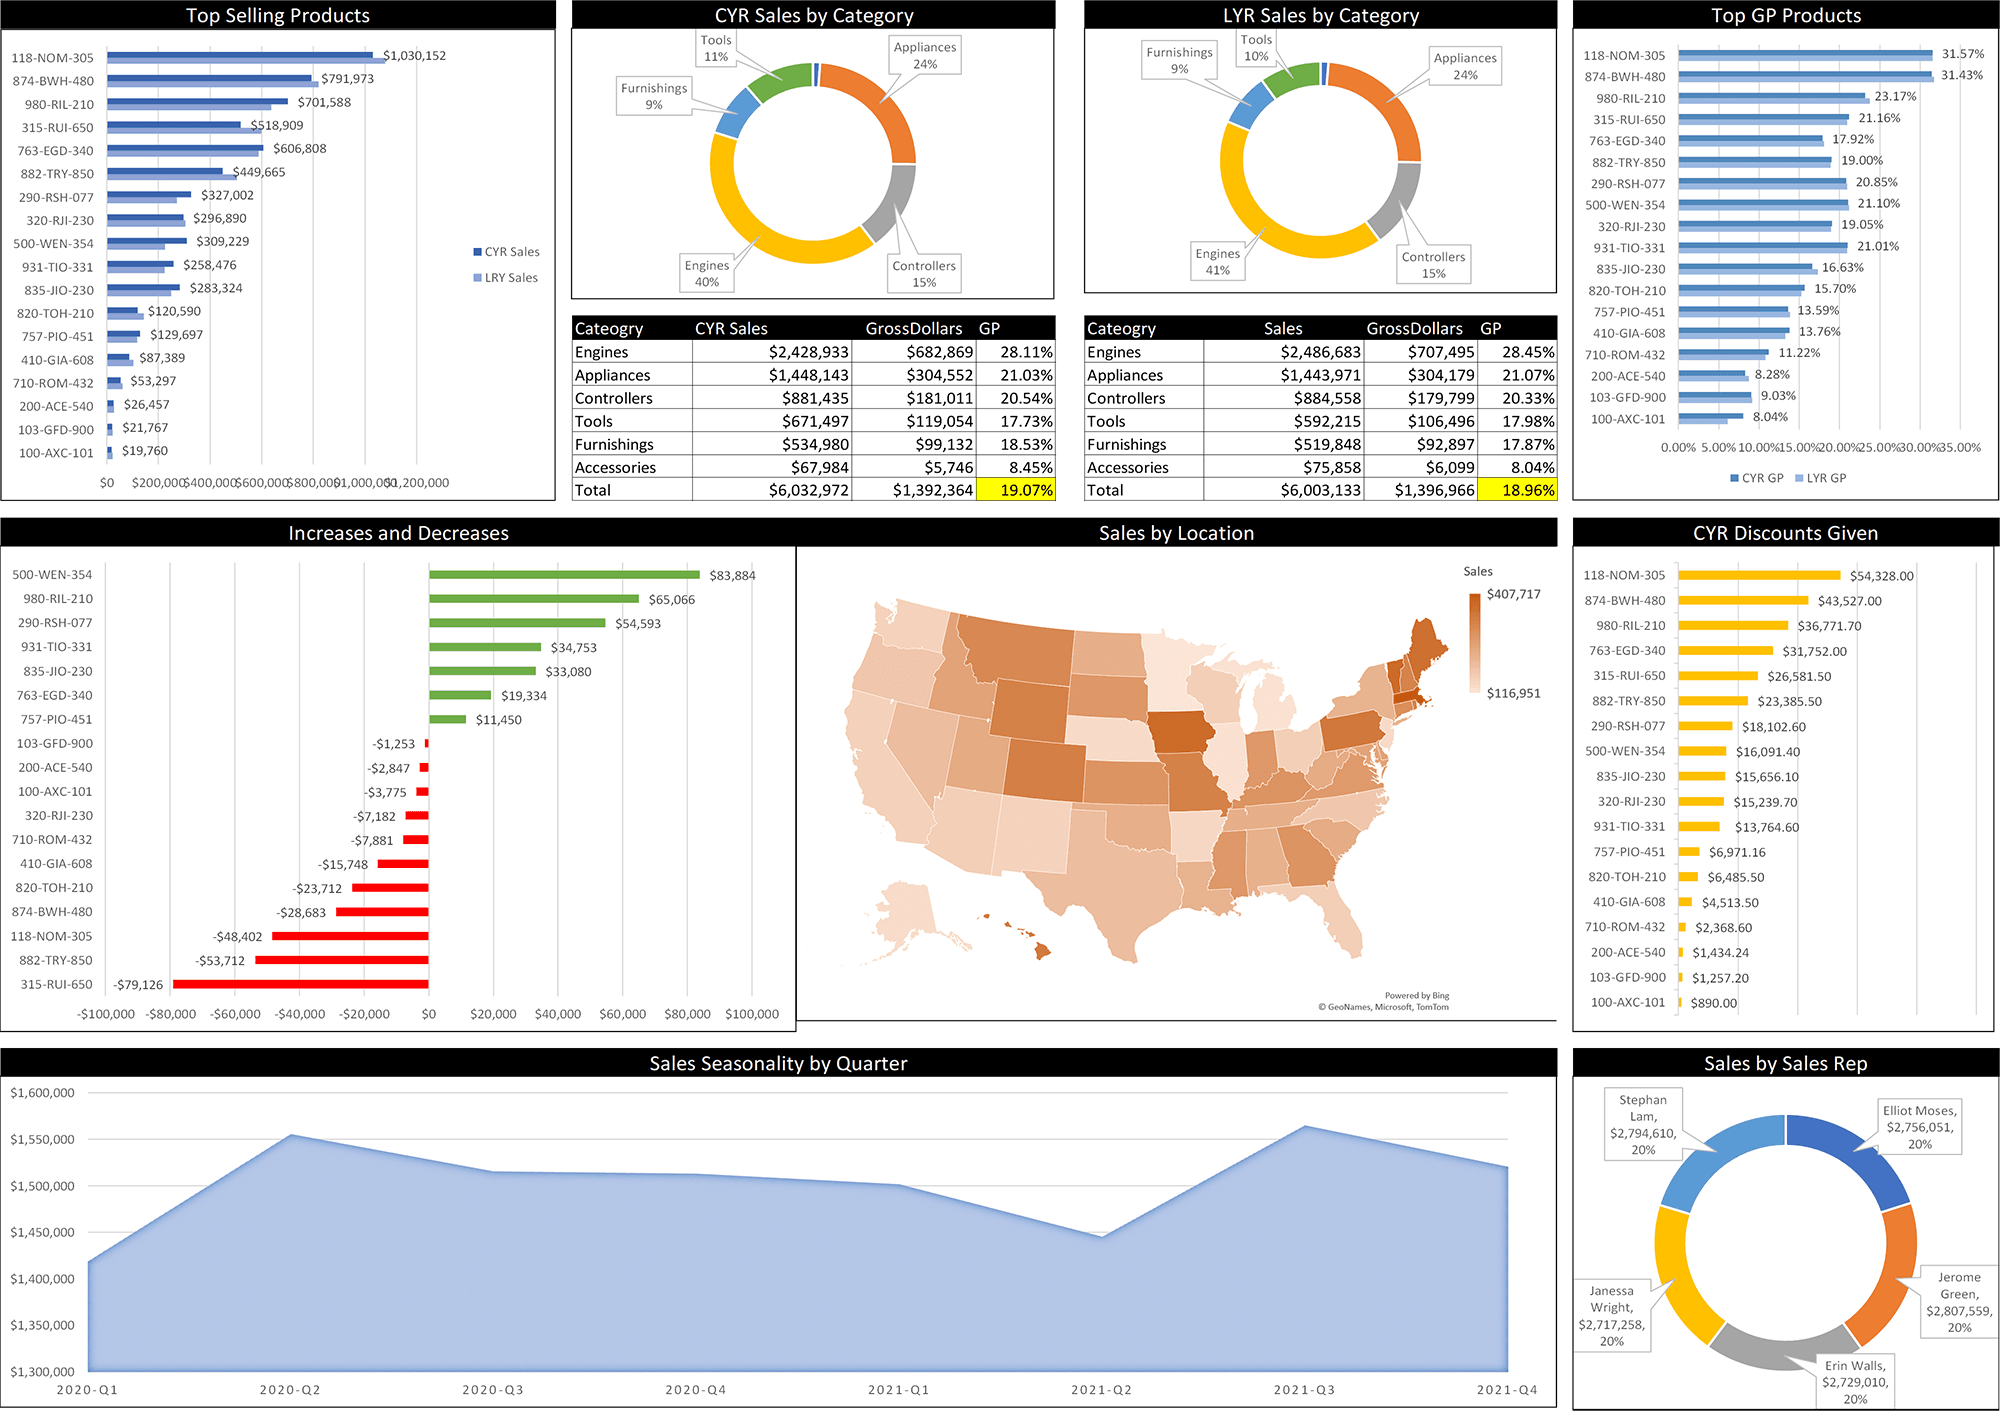
Product Mix and Profitability Excel Dashboard
A product mix and profitability dashboard can help add clarity to a complex area of a business and help a company identify possible issues before they become serious. Business Managers need to know which products are most profitable, and which mix of product sales is optimal for their success. A product-oriented dashboard developed in Excel can help provide instant insights into metrics such as top selling products, increases and decreases by product, gross profit by category, gross profit by customer, sales by sales rep, sales by region, and sales seasonality trends.
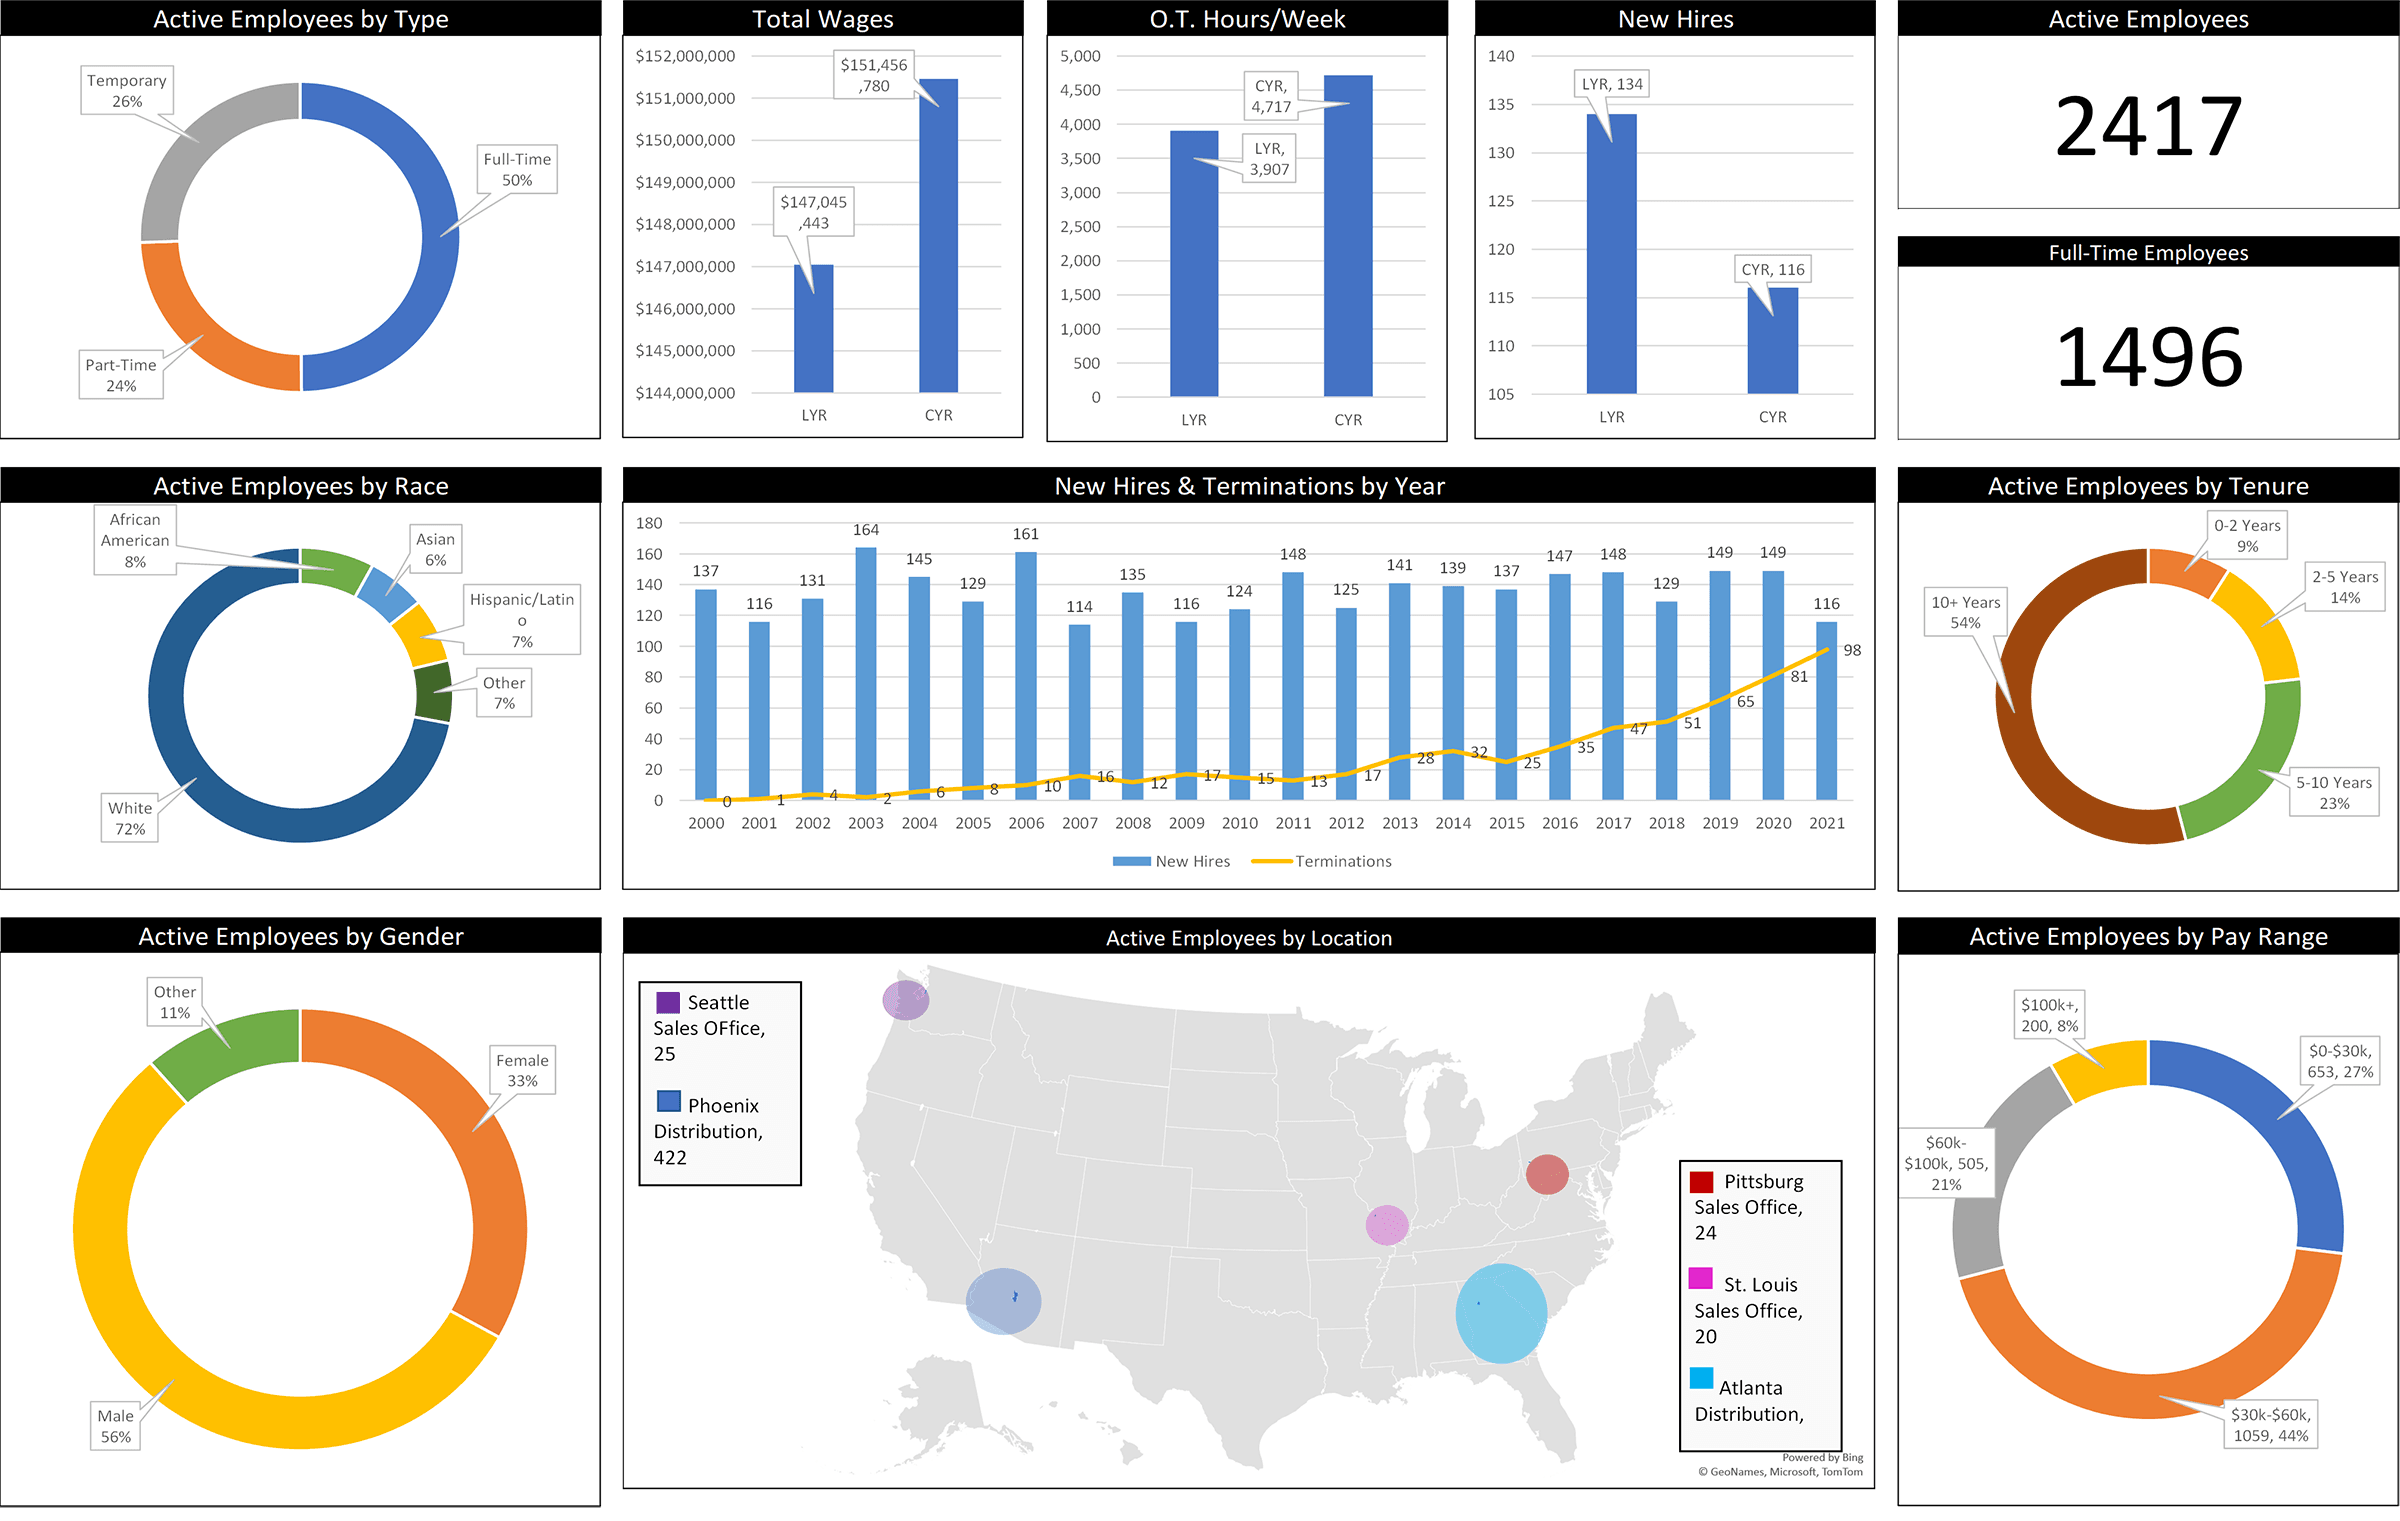
Human Resources Excel Dashboard
Human Resource Managers in today’s world are often asked to manage employees that are in multiple regions performing various roles. Business leaders want to know the condition and makeup of their workforce in real-time. A human resources dashboard developed in Excel can provide instant insights into key people related metrics such as new hires vs. last year, terminations by month, employee wages, employee tenure, workforce makeup, employees by location and overtime wages.